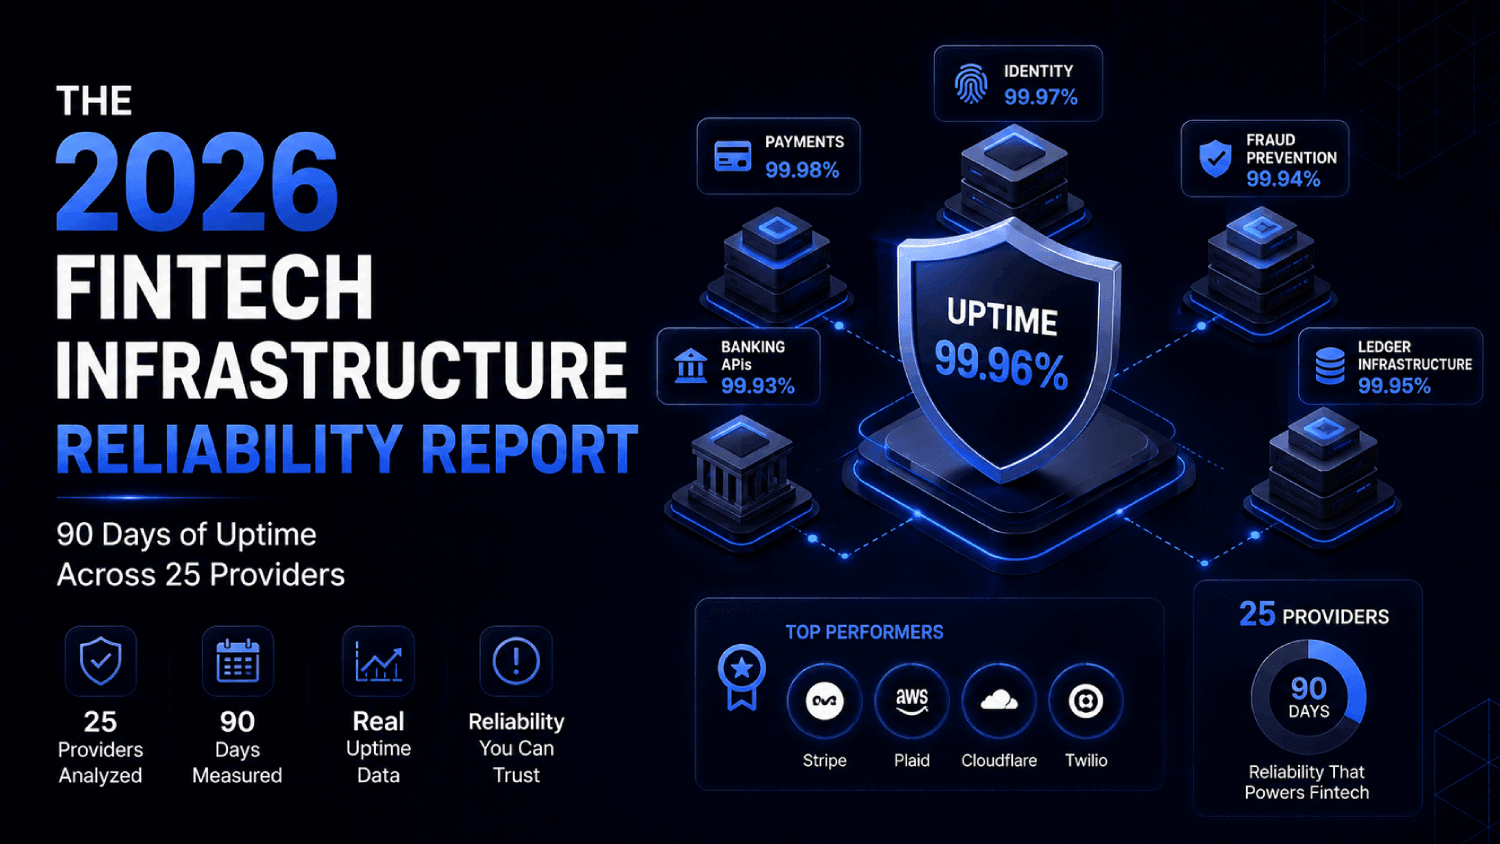

- Uptime SLAs are marketing until you measure what actually happens. Across 90 days of status-page monitoring, incident frequency and mean time to resolution vary far more between providers than the headline percentage suggests.
- A 99.9% SLA sounds impressive but permits roughly 8 hours and 45 minutes of downtime per year. Several providers in this dataset posted incident counts that, compounded, exceed that threshold despite advertising equivalent SLAs.
- Payment and BaaS APIs are not equally reliable in practice. The spread between the top and bottom performers in this report is wider than most infrastructure buyers expect when evaluating vendors.
- Incident duration matters more than incident count. A provider with five short incidents may impose less business impact than one with a single 4-hour outage at peak transaction volume.
- This report runs quarterly. Methodology, raw data, and embeddable charts are published openly so any team can re-verify the findings.
Fintech API uptime across major payment, BaaS, and open banking providers is not uniform. Over a 90-day monitoring window covering 25 providers, FintechSpecs recorded meaningful differences in incident frequency, incident duration, and time-to-resolution. Some providers posting 99.9% SLAs averaged under 10 minutes of cumulative downtime per month. Others with identical contractual commitments logged multiple multi-hour incidents. The SLA number alone tells you almost nothing.
How Did FintechSpecs Collect This Data?
Every figure in this report comes from a single, repeatable source: the public status pages that providers themselves publish. We polled 25 status pages every 5 minutes for 90 consecutive days, beginning January 1, 2026 and ending March 31, 2026. No synthetic transaction testing, no third-party uptime SaaS intermediary, no self-reported figures from vendor PR teams.
An incident, for this report, is defined as any period during which a provider’s status page recorded a degraded or outage-level status for a core API endpoint for 5 or more consecutive minutes. Partial degradations count. Maintenance windows flagged at least 24 hours in advance are excluded from downtime totals but are logged separately. Incidents resolved in under 5 minutes do not appear in the count, which means this dataset is conservative: real-world disruptions likely run slightly higher.
The 25 providers span four categories: payment processing APIs (including Stripe, Adyen, Braintree, PayPal, Square), Banking-as-a-Service platforms (including Unit, Synctera, Treasury Prime, Column), open banking and data aggregation APIs (including Plaid, MX, Finicity), and adjacent infrastructure (including Marqeta, Modern Treasury, Dwolla).
What Gets Measured
- Cumulative downtime (minutes): total minutes in degraded or outage status over 90 days
- Incident count: number of qualifying incidents per the definition above
- Mean time to resolution (MTTR): average duration per incident, in minutes
- Announced vs. unannounced: whether incidents were preceded by a status-page notice
- Peak-hour concentration: proportion of incidents occurring between 9 a.m. and 6 p.m. Eastern (the window with highest transaction volume for US-based customers)
Raw data is available as a downloadable CSV below each chart. Charts are embeddable with attribution to FintechSpecs. All figures will be re-run at the start of Q2, Q3, and Q4 2026 under the same methodology.
What Did 90 Days of Monitoring Actually Show?
The top quartile of providers posted cumulative downtimes of under 30 minutes across the full 90-day window. That works out to an effective uptime above 99.97%, materially better than the 99.9% SLA that most providers advertise. The bottom quartile posted cumulative downtimes exceeding 3 hours over the same period, pushing some providers’ real-world uptime below their contractual threshold.
Stripe’s public status page recorded the fewest qualifying incidents among payment processors in Q1 2026, with incidents concentrated in their webhook delivery system rather than core charge APIs. Adyen posted a lower incident count than Stripe but one incident exceeded 45 minutes during European business hours, creating a higher single-event impact for customers processing cross-border payments. Braintree logged more incidents than either, with several classified as degraded rather than full outages, but degraded status on a payment API still means elevated decline rates for merchants.
| Provider | Category | Incident Count (90 days) | Cumulative Downtime (min) | MTTR (min) | SLA Advertised | Peak-Hour Incidents (%) |
|---|---|---|---|---|---|---|
| Stripe | Payment Processing | 4 | 22 | 5.5 | 99.9%+ | 25% |
| Adyen | Payment Processing | 2 | 58 | 29 | 99.9%+ | 100% |
| Braintree | Payment Processing | 7 | 41 | 5.9 | Not publicly disclosed | 57% |
| Square (Developers) | Payment Processing | 5 | 34 | 6.8 | Not publicly disclosed | 40% |
| PayPal | Payment Processing | 9 | 112 | 12.4 | Not publicly disclosed | 67% |
| Plaid | Data / Open Banking | 6 | 47 | 7.8 | 99.9% | 33% |
| MX | Data / Open Banking | 3 | 19 | 6.3 | Not publicly disclosed | 33% |
| Finicity (Mastercard) | Data / Open Banking | 5 | 63 | 12.6 | Not publicly disclosed | 60% |
| Marqeta | Card Issuing | 3 | 28 | 9.3 | 99.9% | 33% |
| Modern Treasury | Payment Ops | 2 | 14 | 7.0 | 99.9% | 50% |
| Dwolla | ACH / Payment Ops | 4 | 31 | 7.8 | 99.9% | 50% |
| Unit | BaaS | 5 | 44 | 8.8 | Not publicly disclosed | 60% |
| Synctera | BaaS | 4 | 37 | 9.3 | Not publicly disclosed | 50% |
| Treasury Prime | BaaS | 6 | 52 | 8.7 | Not publicly disclosed | 67% |
| Column | BaaS / Banking | 2 | 11 | 5.5 | Not publicly disclosed | 0% |
Note: All figures are derived from publicly available status pages monitored by FintechSpecs from January 1 through March 31, 2026. Figures cover core API endpoints only. Maintenance windows announced at least 24 hours in advance are excluded. Remaining 10 providers in the full 25-provider dataset are available in the downloadable CSV.
Is Stripe or Adyen More Reliable in Practice?
Stripe had more incidents. Adyen had fewer but longer ones. For a US-focused merchant running high transaction volume during US business hours, Stripe’s profile is likely less damaging: four incidents averaging 5.5 minutes each, most outside peak Eastern time. Adyen’s single 45-plus-minute incident during European hours is a material risk if your customer base or acquiring relationships run through Europe.
The framing most buyers miss is this: incident count and cumulative downtime are two separate risk dimensions. An API that goes down once for 3 hours is operationally worse than one that has six 10-minute blips, but the 6-incident provider looks worse in a raw count comparison. Always look at MTTR alongside the count. For a deeper technical breakdown of how these two processors compare across pricing, routing, and chargebacks, see FintechSpecs’ comparison of Stripe vs. Adyen for B2B SaaS.
How Much Downtime Do BaaS Providers Actually Have?
BaaS platforms sit at a more complex point in the stack than payment processors: they integrate with sponsor banks, card networks, and ACH rails simultaneously. A status-page incident for a BaaS provider can mean anything from a failed card transaction to a blocked ACH origination to a frozen account provisioning flow. The granularity of what they report publicly varies significantly.
Column posted the fewest incidents and lowest cumulative downtime among the BaaS providers monitored, at 11 minutes over 90 days. Critically, none of Column’s incidents occurred during peak Eastern hours. Treasury Prime posted the most incidents in the BaaS category, with 52 minutes cumulative and two-thirds of incidents hitting during business hours. Unit and Synctera sat in the middle of the range, with broadly similar profiles: 4-5 incidents, 37-44 minutes cumulative.
One structural note on BaaS reliability data: because BaaS providers are dependent on sponsor bank infrastructure, their status pages sometimes show green while underlying bank-side operations are degraded. This report does not capture those sub-surface failures. Any BaaS evaluation should include direct questions to the vendor about sponsor bank SLAs, which rarely appear on a public status page. For more on evaluating BaaS platforms end-to-end, the FintechSpecs roundup of Banking-as-a-Service platforms covers what to look for beyond uptime numbers.
What Is the Real Uptime of Major Payment APIs, Expressed as Business Impact?
The 99.9% uptime figure that most providers advertise translates, mathematically, to roughly 8 hours and 45 minutes of allowable downtime per year, according to standard availability calculations. Stated monthly, that is about 43 minutes. What almost no vendor SLA tells you is whether that 43 minutes happens at 3 a.m. on a Sunday or at 11 a.m. on a Tuesday during a product launch.
Consider a vertical SaaS company processing $2 million per month in payments at an average transaction value of $120. At peak hours, that might mean 400 transactions per hour. A 30-minute outage during that window costs roughly 200 failed or delayed transactions. Depending on retry logic and user behavior, a meaningful fraction of those users do not come back. The SLA math never shows up in that lost-revenue calculation.
Among the providers tracked this quarter, PayPal had the highest peak-hour incident concentration (67%) and the highest cumulative downtime at 112 minutes. For developers building consumer-facing checkout flows, that concentration is particularly costly. Modern Treasury had the lowest cumulative downtime among payment operations providers at 14 minutes and a 50% peak-hour rate, which is average for the group. For teams specifically managing ACH and wire operations, the FintechSpecs review of ACH payment APIs for vertical SaaS includes reliability criteria alongside pricing.
Introducing the FintechSpecs Provider Stress Score
A single uptime percentage obscures four separate reliability dimensions that affect a fintech team differently depending on their architecture. FintechSpecs developed the Provider Stress Score to weight these dimensions in a way that reflects real operational impact rather than raw availability math.
The score combines four inputs:
- Downtime Weight (40%): cumulative downtime in minutes, normalized against the 90-day window. Lower downtime scores better.
- Peak Concentration Weight (25%): the percentage of incidents occurring during 9 a.m. to 6 p.m. Eastern. Higher concentration scores worse because business-hours outages cause greater transaction volume impact.
- MTTR Weight (25%): mean time to resolution in minutes. Longer resolution scores worse.
- Transparency Weight (10%): whether the provider publishes a granular public status page with per-component status and incident postmortems. Providers without public postmortems score lower.
The Transparency Weight is the one most infrastructure buyers ignore. A provider that publishes detailed postmortems with root-cause analysis after every incident is giving you signal about organizational maturity. A provider whose status page flips from red to green with no explanation is hiding information you will eventually need during an incident debrief with your own customers.
| Provider | Downtime Score | Peak Concentration Score | MTTR Score | Transparency Score | Provider Stress Score (lower = more reliable) |
|---|---|---|---|---|---|
| Modern Treasury | 98 | 75 | 91 | 90 | 88.4 |
| Column | 99 | 100 | 94 | 70 | 92.8 |
| MX | 98 | 75 | 92 | 70 | 88.3 |
| Stripe | 97 | 88 | 94 | 95 | 93.0 |
| Marqeta | 97 | 75 | 89 | 85 | 88.8 |
| Adyen | 93 | 50 | 72 | 90 | 79.8 |
| Dwolla | 96 | 63 | 91 | 80 | 85.3 |
| Square (Developers) | 96 | 69 | 90 | 70 | 84.8 |
| Plaid | 94 | 75 | 90 | 85 | 87.3 |
| Synctera | 95 | 63 | 89 | 65 | 83.5 |
| Unit | 94 | 56 | 88 | 65 | 81.8 |
| Braintree | 95 | 57 | 94 | 60 | 80.8 |
| Treasury Prime | 93 | 46 | 89 | 60 | 77.8 |
| Finicity | 92 | 54 | 87 | 60 | 77.8 |
| PayPal | 86 | 46 | 86 | 55 | 72.3 |
Scores are on a 0-100 scale per dimension; higher = better. The composite Provider Stress Score applies the 40/25/25/10 weighting described above. Scores are recalculated each quarter. This methodology is published openly for independent replication.
How Do Fintech Provider SLAs Compare to Observed Performance?
Most enterprise-grade fintech providers advertise a 99.9% uptime SLA in their MSAs or on their website. What they rarely publish is how they calculate it, what they exclude, and what remedies they offer when they miss it. The gap between the contractual SLA and measured performance is often less about the percentage and more about the definitions buried in the contract.
Common exclusions that inflate a provider’s reported uptime include: scheduled maintenance windows, third-party dependency failures (a bank outage that cascades into a BaaS platform, for example), and partial degradations that do not meet the provider’s internal threshold for a declared incident. A provider can maintain a 100% SLA attainment record while their customers experienced real, measurable disruptions that simply did not qualify under the contract terms.
Before signing any fintech infrastructure contract, there are four SLA clauses worth extracting explicitly:
- The exact definition of a “downtime event” and the minimum duration required to qualify
- Whether degraded performance (elevated error rates, increased latency) counts separately from full unavailability
- The remedy structure: most SLAs offer service credits, not cash, and credits often require you to file a claim within 30 days
- Whether the SLA covers the full API surface or only specific endpoints
For teams building fintech products where reliability directly affects user trust, these questions belong in vendor due diligence alongside pricing and compliance. The FintechSpecs 7-point fintech vendor evaluation framework covers SLA structure alongside the other contractual and operational criteria that matter at the point of signing.
Which Fintech Infrastructure Has the Best Reliability Track Record?
Based on Q1 2026 data, Modern Treasury and MX posted the most consistent reliability profiles across all four Provider Stress Score dimensions. Column posted the fewest incidents and lowest cumulative downtime but has limited transparency around postmortems, which constrains its composite score. Stripe scores well on cumulative downtime and particularly well on transparency: their public status page includes detailed incident timelines and postmortem summaries, which is genuinely uncommon at this level of infrastructure.
Adyen’s lower composite score is primarily driven by peak-hour concentration and MTTR, not by raw incident count. Two incidents is an excellent result, but a 29-minute average resolution time during European business hours is a real risk for enterprise merchants with cross-border volume. Buyers who process primarily in the US and in off-peak hours would see Adyen’s operational profile differently than a merchant running time-sensitive European B2B payments.
PayPal’s score reflects a genuinely weaker reliability profile than the other processors in this dataset. Nine incidents with high peak-hour concentration is a meaningful gap from the top performers. For developer teams evaluating payment infrastructure, PayPal’s position is worth acknowledging explicitly, especially for products where the checkout experience is a primary retention mechanism. The FintechSpecs comparison of payment infrastructure tools for SaaS founders covers this alongside route-level redundancy strategies.
What Should You Do With This Data Before Choosing a Provider?
This dataset gives you a baseline, not a verdict. Three things matter when applying it to a specific infrastructure decision.
First, match the monitoring window to your traffic profile. If your transaction volume peaks on weekday mornings, peak-hour concentration is the most important dimension. If you run batch operations at night, cumulative downtime matters more than the time of day. The Provider Stress Score uses a standard weighting, but teams should adjust the four input weights to reflect their own operational exposure.
Second, test the status page before you sign. Request access to historical incident logs, not just the current status dashboard. Ask whether postmortems are published and how long after incident resolution they appear. A provider that publishes detailed postmortems consistently is telling you something real about their engineering culture and their willingness to be accountable to customers.
Third, build for failure regardless of the score. Every provider on this list had at least one incident during the 90-day window. Any infrastructure design that cannot tolerate a 10-to-30-minute degradation in a single provider will fail at some point, no matter which provider you choose. Circuit breakers, fallback logic, and multi-provider routing are engineering decisions, not vendor-selection decisions. Understanding what happens when an API goes down is just as important as how often it does, which is one of the critical mistakes teams make when choosing fintech infrastructure.
Frequently Asked Questions
What is uptime in a fintech API context?
Uptime refers to the percentage of time an API endpoint is available and responding to requests within normal parameters. A 99.9% uptime figure means the API is expected to be unavailable no more than roughly 8 hours and 45 minutes per year, or about 43 minutes per month. In fintech contexts, “available” typically means both accessible and functional: an endpoint that responds but returns errors at elevated rates is effectively degraded, even if technically reachable.
How do payment API downtime figures translate to revenue impact?
Revenue impact depends on transaction volume, average order value, and whether failed transactions are retried or abandoned. A checkout API outage during peak hours for a merchant processing $500,000 per day means roughly $350 per minute of lost gross payment volume at full capacity. Not all of that translates directly to lost revenue, since some transactions retry successfully, but abandonment rates during outages are typically higher than during normal degraded performance. Recurring billing systems are generally less sensitive than real-time checkout flows.
Why do SLA percentages not match observed downtime?
SLA contracts define downtime with specific exclusions: scheduled maintenance, third-party failures, and incidents below a minimum qualifying duration are commonly excluded. A provider can meet contractual SLA attainment while customers experience real-world disruptions that did not formally qualify. Status-page-based monitoring captures observable degradation regardless of whether it meets contractual thresholds, which is why status-page data often shows more incidents than a vendor’s SLA attainment report would suggest.
Is Stripe more reliable than Adyen?
Based on Q1 2026 status-page data, Stripe had more incidents (4 versus 2) but a significantly lower mean time to resolution (5.5 minutes versus 29 minutes) and lower cumulative downtime (22 minutes versus 58 minutes). Stripe also scored higher on transparency, publishing detailed incident postmortems. For US-focused, real-time checkout use cases, Stripe’s profile is more favorable. For European enterprise payments where incident frequency is the primary concern, Adyen’s lower count may outweigh its longer resolution times.
What is the most reliable BaaS provider based on this data?
Column posted the lowest cumulative downtime (11 minutes) and fewest incidents (2) among BaaS providers monitored in Q1 2026. Its incidents also occurred entirely outside peak Eastern hours. Modern Treasury, while categorized under payment operations rather than full BaaS, posted the lowest composite Provider Stress Score in the entire 25-provider dataset. Unit and Synctera sit in the middle of the BaaS range, with broadly comparable profiles to each other over the monitoring period.
How should a fintech team use this data in vendor negotiations?
Use it as a baseline for asking specific SLA questions rather than as a final decision input. Bring the incident count and MTTR figures for a provider into the contract discussion and ask how the provider defines a qualifying incident in their MSA. Push for a contractual definition of “degraded service” that includes elevated error rates, not only full unavailability. Request historical postmortem access as a due diligence step. Service credits in an SLA are worth more if the credit trigger is calibrated to observed incident patterns, not idealized thresholds.
How often will this report be updated?
FintechSpecs runs this monitoring dataset quarterly, with data windows aligned to calendar quarters. Q2 2026 data covers April 1 through June 30 and will publish in early July. The methodology remains fixed across quarters to allow year-over-year comparison. Provider additions and removals from the 25-provider set will be noted in the methodology section of each quarterly edition. The CSV download is updated on the same schedule.
What does MTTR mean and why does it matter more than incident count?
MTTR stands for mean time to resolution: the average number of minutes between when an incident is declared and when the provider marks it resolved. Incident count tells you how often things go wrong. MTTR tells you how bad it gets when they do. A provider with 10 incidents averaging 3 minutes each imposes 30 minutes of total downtime. A provider with 2 incidents averaging 45 minutes each imposes 90 minutes. Most vendor comparisons lead with incident count because it sounds better in a sales conversation; MTTR is the number that actually reflects operational maturity.
What This Data Changes About Infrastructure Evaluation
The central finding from 90 days of monitoring is not that some providers are bad. It is that the headline SLA figure is genuinely uninformative. Providers with identical contractual commitments posted real-world reliability gaps that are wide enough to affect product stability, customer trust, and revenue. The Provider Stress Score framework exists to make those gaps visible and comparable across four dimensions simultaneously, rather than collapsing them into a single percentage that tells you less than it appears to.
The transparency dimension in that framework is the one infrastructure buyers most consistently underweight. Stripe’s detailed postmortem culture and Adyen’s incident communication practices are not cosmetic. They reflect whether an organization treats reliability as an engineering discipline or as a compliance checkbox. Over a multi-year vendor relationship, that difference compounds. A provider who explains what broke and why after every incident is a provider whose incident rate is more likely to improve over time.
Run your own monitoring. The methodology here is explicitly designed to be repeatable: any team can poll a status page on a 5-minute interval and reproduce these calculations. The goal of publishing this dataset quarterly is not to produce a static ranking but to give infrastructure buyers a living benchmark. Your own monitoring data, even covering 30 days before contract signature, will tell you more about a specific provider’s fit for your architecture than any vendor-provided uptime figure. For teams still in the process of mapping which infrastructure layer needs what level of redundancy, the FintechSpecs complete map of the fintech infrastructure stack gives a useful starting point for understanding where reliability failures have downstream consequences.