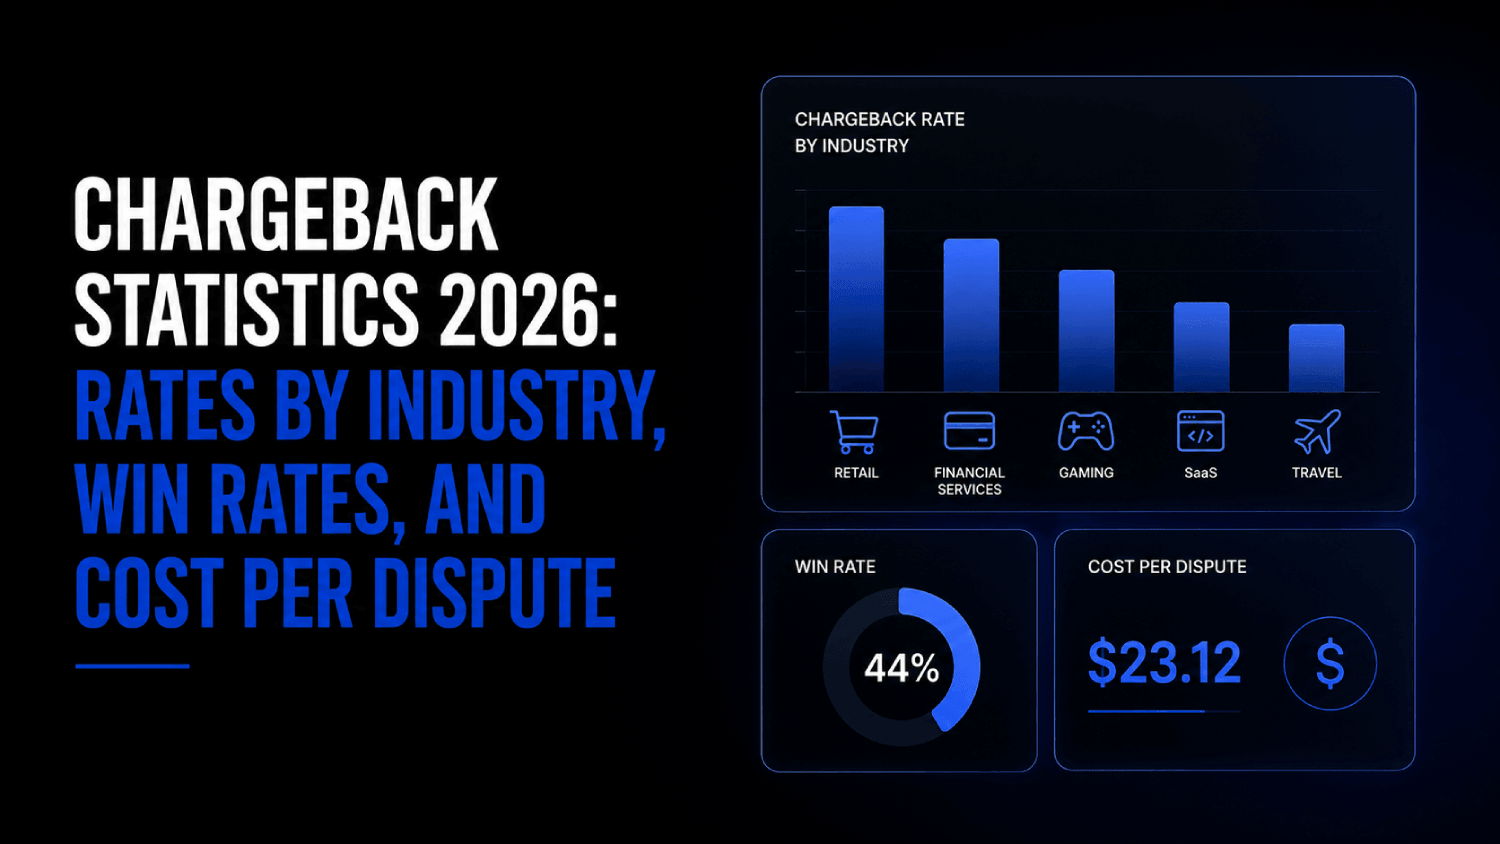

- U.S. chargeback volume is estimated to reach 146 million disputes valued at $15.3 billion in 2026, according to industry projections cited across multiple payment research sources.
- The average chargeback rate hit 0.26% in Q3 2025, up from 0.17% in prior periods, a 53% increase according to benchmark data cited in chargeback trend analyses.
- A single chargeback costs merchants far more than the disputed transaction amount once fees, operational time, and lost merchandise are factored in.
- Friendly fraud now drives the majority of disputes in most card-not-present verticals, making blanket fraud framing the wrong response for most merchants.
- Win rates and cost-per-dispute vary enough by industry and dispute type that treating chargebacks as a fixed overhead is a strategic mistake, not just an accounting one.
Chargeback statistics for 2026 point to a market under consistent pressure: the average U.S. merchant chargeback rate sits around 0.26% of transactions as of late 2025, with card networks setting the warning threshold at 1% and the termination threshold higher still. Global CNP fraud losses are projected to reach $28.1 billion by 2026. Merchants who dispute chargebacks win roughly 30% to 40% of cases on average, though rates vary sharply by vertical, evidence quality, and whether alerts were used to intercept the dispute before it filed.
What Is the Average Chargeback Rate by Industry?
Card network thresholds are often cited as the benchmark, but they are not the same as the industry average. Visa’s standard monitoring program begins at 0.9% of transactions per month. Mastercard’s Excessive Chargeback Program triggers at 1.5 chargebacks per 100 transactions. Crossing either threshold brings fees, added monitoring, and eventually account termination risk.
Most merchants operate well below those thresholds, which is exactly why citing them as a target is misleading. According to data surfaced by SwipeSum and Zen Payments, average chargeback rates differ significantly by vertical.
| Industry | Typical Chargeback Rate Range | Primary Dispute Driver |
|---|---|---|
| Digital goods / software subscriptions | 0.5% to 0.9% | Friendly fraud, forgotten subscriptions |
| Travel and hospitality | 0.5% to 1.2% | Cancellation disputes, service non-delivery |
| Online gaming / gambling | 0.3% to 0.8% | Buyer’s remorse, unauthorized claim |
| General e-commerce | 0.2% to 0.5% | Item not received, not as described |
| Physical retail (card present) | 0.01% to 0.05% | True fraud, processing errors |
| Healthcare / telehealth | 0.1% to 0.3% | Service disputes, billing confusion |
| Financial services / lending | 0.1% to 0.4% | Unauthorized, account takeover |
Benchmark data cited across chargeback trend analyses puts the blended average across monitored merchants at 0.26% as of Q3 2025. That number represents a 53% increase from the prior 0.17% baseline, driven primarily by card-not-present volume growth and rising friendly fraud filings.
How Much Does a Chargeback Actually Cost?
The disputed transaction amount is the smallest line item in the real cost of a chargeback. The fuller picture includes the chargeback fee from the acquirer, the cost of the merchandise (if physical and already shipped), operational time spent gathering evidence, and the downstream risk of being placed in a monitoring program.
According to Mastercard’s public guidance on dispute economics, the total cost to a merchant of a single chargeback typically runs two to three times the original transaction value when fees and overhead are included. For low-ticket transactions under $50, the math often makes fighting the dispute unprofitable.
| Cost Component | Typical Range | Notes |
|---|---|---|
| Acquirer chargeback fee | $15 to $100 per dispute | Varies by processor and merchant tier |
| Lost transaction revenue | 100% of sale amount | Reversed regardless of dispute outcome if merchant loses |
| Cost of goods (physical) | Variable | Not recovered even if dispute is won |
| Chargeback management labor | $25 to $50 per dispute handled internally | Based on internal ops time estimates |
| Monitoring program surcharges | $5 to $50 per transaction in excess of threshold | Applied monthly once flagged by Visa or Mastercard |
For SaaS founders tracking unit economics, unmanaged chargeback costs belong in the same conversation as payment processing fees. The hidden costs killing fintech SaaS margins often include chargeback overhead that never shows up in a gross margin calculation until it is already significant.
What Is the Average Chargeback Win Rate?
Merchants who fight chargebacks win between 30% and 45% of cases on average, based on figures cited by Solidgate and other dispute management providers. That range is wide because win rates are not random. They depend on three variables: the reason code filed, the quality of evidence submitted, and whether the merchant used pre-dispute tools like alerts.
Friendly fraud cases, where a legitimate cardholder disputes a valid charge, tend to have higher merchant win rates when compelling evidence exists. True fraud cases, where the card was used without the cardholder’s knowledge, are harder to win because the issuer typically sides with the cardholder regardless of the merchant’s documentation.
| Dispute Type | Estimated Merchant Win Rate | Key Evidence That Shifts the Outcome |
|---|---|---|
| Friendly fraud (item received, service used) | 40% to 60% | Login logs, delivery confirmation, usage data |
| Item not received (legitimate) | 20% to 35% | Carrier tracking, delivery signature |
| Subscription / recurring billing | 35% to 50% | Recorded consent, clear cancellation policy |
| True fraud (unauthorized transaction) | 10% to 20% | 3DS authentication data, device fingerprint |
| Credit not processed | 50% to 70% | Refund records, customer communications |
Merchants using chargeback alert services like Verifi RDR or Ethoca intercept disputes before they formally file, which removes them from win-rate calculations entirely. That interception layer is why comparing raw win rates between a merchant using alerts and one that is not produces meaningless data. The best chargeback alert services for SaaS and fintech operate differently enough that the choice between them affects both cost and what disputes even reach the response stage.
What Do Friendly Fraud Statistics Actually Show?
Friendly fraud is the dominant chargeback driver in card-not-present environments. It refers to disputes filed by cardholders who received the goods or services but claim otherwise, whether intentionally or through genuine confusion about a charge on their statement.
Multiple industry reports, including data cited by Chargeflow and dispute analytics providers, consistently find that 60% to 80% of chargebacks in digital commerce are attributable to friendly fraud rather than true unauthorized use. By 2026, CNP fraud losses globally are projected to reach $28.1 billion, according to research cited in Juniper’s chargeback management market report, a 40% increase from the $20 billion baseline reported in 2023.
The implication for merchants is direct. If most of your chargebacks are friendly fraud, your fraud prevention stack is solving the wrong problem. The correct response is better transaction documentation, faster dispute response, and pre-dispute alert enrollment, not more aggressive authorization declines that hurt conversion rates. This is the same tension covered in the fraud prevention versus user experience trade-off every fintech faces.
How to Calculate Your Chargeback Rate
Card networks define chargeback rate differently, which is where merchants get tripped up. Visa calculates chargeback rate as the number of chargebacks in a given month divided by the number of transactions in that same month. Mastercard uses chargebacks received in a month divided by transactions processed in the prior month. That lag can make your rate look better or worse depending on your growth trajectory.
The formula most processors use:
Chargeback Rate = (Number of Chargebacks in Month) / (Number of Transactions in Month) x 100
A merchant processing 10,000 transactions per month and receiving 30 chargebacks has a 0.30% chargeback rate. That sits above the reported average of 0.26% but well below the Visa monitoring threshold of 0.90%. Knowing where you sit relative to benchmarks, not just thresholds, is the more useful framing for any operator benchmarking their dispute health.
The FintechSpecs Dispute Exposure Score: A Framework for Where Your Risk Actually Lives
Most merchants focus on their overall chargeback rate. That single number obscures more than it reveals. A blended 0.30% rate across 10,000 transactions could mean 30 evenly distributed disputes, or it could mean one product SKU or subscription tier generating 25 of those disputes while everything else runs clean.
The FintechSpecs Dispute Exposure Score breaks chargeback risk into three components, each of which requires a different response:
Volume Concentration: What share of your chargebacks come from your top five SKUs, subscription tiers, or customer segments? If 20% of your products generate 80% of disputes, the fix is targeted, not systemic.
Reason Code Distribution: Are most disputes clustering around “item not received,” “not as described,” or “unauthorized”? Reason code concentration tells you whether your problem is logistics, product description accuracy, or fraud vectoring, three entirely different remediation paths.
Recovery Rate by Channel: What percentage of chargebacks were you never notified of in time to respond? Merchants using no alert service often discover disputes only after the chargeback has already posted, making response impossible. Measuring your reachable dispute rate versus total dispute rate shows the actual gap your tooling stack needs to close.
Here is how that analysis looks in practice. A B2B SaaS company processes 8,000 transactions per month and has a blended chargeback rate of 0.35%, generating 28 disputes. Running the Dispute Exposure Score reveals that 22 of those 28 disputes carry the reason code “subscription canceled, billing continued” and all 22 come from a single annual plan tier that renews without a pre-renewal email. Volume Concentration: one tier, 79% of all disputes. Reason Code Distribution: 100% subscription/recurring billing reason codes. Recovery Rate by Channel: the company has no alert enrollment, so 100% of disputes posted before they could respond. The correct intervention is not a representment tool. It is a pre-renewal notification sequence and Verifi RDR enrollment for that billing tier. Running the score first made that obvious before any vendor was purchased.
Running this three-part analysis before purchasing any chargeback management software prevents the common mistake of buying a representment tool when the real problem is pre-dispute interception, or vice versa. Operators evaluating the tooling options can compare the field in detail through the best chargeback management tools for B2B SaaS and fintech.
Are Chargebacks Increasing?
Yes, materially. The U.S. chargeback volume trajectory is rising across nearly every card-not-present vertical. Projected to reach 146 million disputes in 2026 at a total value of $15.3 billion, the growth is tied to e-commerce volume growth, subscription billing expansion, and rising consumer awareness that chargebacks are available as a dispute mechanism.
Gitnux data cited in chargeback trend analyses notes that chargeback rates were expected to rise 15% by 2025 due to e-commerce growth alone. Adoption of 3D Secure 2.0 has offset some of that growth. According to Gitnux, 3DS 2.0 adoption reduced chargebacks by up to 60% in markets with high implementation rates. But adoption remains uneven, meaning the protection gap continues to generate disputes that 3DS would have prevented.
For SaaS companies specifically, subscription chargebacks track closely with failed dunning cycles and billing confusion. Merchants who address dunning failures before they escalate to disputes catch a material share of what would otherwise become a chargeback. The relationship between chargeback rates and payment infrastructure choices is one of the underappreciated points in the best payment infrastructure tools for SaaS founders comparison.
What Chargeback Rate Benchmarks Should You Actually Use?
Card network thresholds answer the question “when do I get in trouble.” Industry averages answer the question “how do I compare to peers.” Those two numbers are not the same thing, and conflating them produces a false sense of safety or unnecessary alarm.
If your vertical average is 0.60% and you are at 0.55%, you are performing in line with your industry even though you are approaching Visa’s warning threshold. A general e-commerce merchant at 0.55% is underperforming their industry average of 0.20% to 0.50% while remaining below the formal threshold. The benchmark table above provides more useful context than the card network thresholds alone.
Merchants selling through merchant-of-record platforms like Paddle or Lemon Squeezy transfer chargeback liability to the MoR, which changes the math entirely. The merchant-of-record comparison for B2B SaaS founders explains which platforms absorb dispute risk and which leave it with the seller, a distinction that affects total cost of disputes significantly.
Frequently Asked Questions
What percentage of chargebacks are won by merchants?
Merchants win roughly 30% to 45% of chargebacks they dispute on average, based on figures reported by dispute management providers including Solidgate. Win rates climb to 40% to 60% for friendly fraud cases where the merchant holds strong transaction evidence such as delivery confirmation, login records, and customer communications. True fraud cases, where the card was genuinely compromised, produce win rates closer to 10% to 20% regardless of evidence quality.
How much does a chargeback cost a merchant?
A single chargeback typically costs two to three times the original transaction value when all components are included. Acquirer chargeback fees range from $15 to $100 per dispute. Add the reversed transaction amount, cost of goods already delivered, internal labor for evidence gathering (estimated at $25 to $50 per dispute), and potential monitoring program surcharges. For transactions under $50, disputing is often more expensive than accepting the loss.
What is the chargeback threshold before a merchant gets flagged?
Visa’s standard monitoring program triggers at a 0.9% chargeback rate per month. Mastercard’s Excessive Chargeback Program begins at 1.5 chargebacks per 100 transactions. Crossing these thresholds initiates fees and formal oversight programs that escalate toward account termination if not resolved. Most merchants operate between 0.1% and 0.5%, meaning the thresholds are not a useful day-to-day benchmark for healthy operations.
What share of chargebacks are friendly fraud?
Estimates across dispute analytics providers consistently place friendly fraud at 60% to 80% of all card-not-present chargebacks. This category includes both intentional misuse of the dispute process and genuine cardholder confusion about a charge, such as a subscription billing under a company name the customer does not recognize. For digital goods and SaaS merchants specifically, that share sits toward the higher end of the range.
How do I calculate my chargeback rate?
Divide the number of chargebacks received in a given month by the total number of transactions processed in that same month, then multiply by 100. A merchant with 10,000 transactions and 30 chargebacks in a month has a 0.30% chargeback rate. Note that Mastercard uses prior-month transaction volume as the denominator rather than current-month, which produces slightly different results during periods of rapid volume growth.
Do chargeback alert services actually reduce dispute rates?
Yes, when used for the right dispute types. Services like Verifi RDR and Ethoca intercept disputes at the issuer level before they formally file as chargebacks. For friendly fraud and subscription disputes, interception rates are high because the cardholder is still reachable before the dispute posts. For true unauthorized fraud, alerts are less effective because the issuer often proceeds regardless. Pre-dispute interception does not count against a merchant’s chargeback rate, which is the primary operational benefit.
Are chargebacks rising in 2026?
Yes. U.S. chargeback volume is projected to reach 146 million disputes in 2026, valued at $15.3 billion. Global CNP fraud losses are projected to reach $28.1 billion by 2026, a 40% increase from $20 billion in 2023. Benchmark data cited in chargeback trend analyses reported a 53% increase in average chargeback rates between prior periods and Q3 2025. E-commerce volume growth, subscription billing expansion, and increased consumer awareness of the dispute mechanism are the primary drivers.
Does 3D Secure reduce chargebacks?
Measurably, yes, in markets with high adoption. Gitnux data cited in chargeback trend analyses attributes up to a 60% reduction in chargebacks to 3DS 2.0 adoption in high-implementation markets. The protection comes from the liability shift: when 3DS authentication is completed, issuer liability applies instead of merchant liability for unauthorized fraud disputes. Markets with lower 3DS adoption rates, including significant portions of U.S. e-commerce, see less protection because the liability shift does not apply to unauthenticated transactions.
How to Use These Benchmarks
A chargeback rate of 0.26% blended across your entire transaction volume means nothing in isolation. The useful number is your rate within your vertical, by product line, and by reason code cluster. A SaaS company with a 0.45% overall rate might discover that 80% of those disputes come from a single pricing tier with confusing renewal messaging, a fixable problem that has nothing to do with fraud infrastructure.
The fraud detection stack, the alert service layer, and the dispute response process each address different parts of the problem. Buying all three without first running the FintechSpecs Dispute Exposure Score analysis above produces expensive redundancy rather than protection. Operators who track chargeback rates alongside other payment health signals tend to catch the concentration problem earlier. That framing appears repeatedly in the list of fintech metrics that actually matter beyond vanity growth, where chargeback rate belongs next to authorization rate and payment failure rate as a core operational signal.
The numbers on this page are updated as new benchmark data becomes publicly available. If you are citing these benchmarks in research or tooling comparisons, the inline sources link to the originating reports. The dispute cluster on this site covers alert services, issuer software, and the full merchant tooling field for readers ready to move from benchmarking to action.